
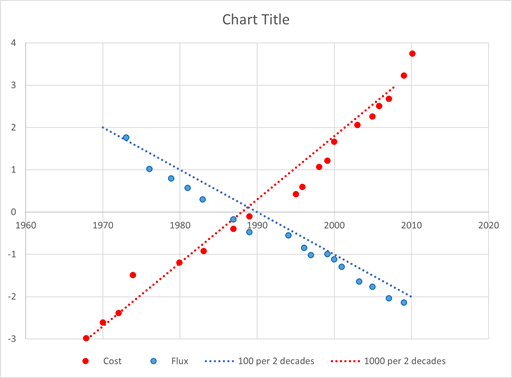
A value of 100 per 2 decades can be supported but its use is not so clearcut
We have Haitz’s Law which claims that every decade, the cost per lumen (unit of useful light emitted) falls by a factor of 10, and the amount of light generated per LED package increases by a factor of 20, for a given wavelength of light. I have plotted the data from the figure and fitted lines for a factor 100 and 1000 change per 20 years.
Swanson’s Law, which compares the installed capacity and cost per module of solar power, is not such a good fit. I have plotted the data from the figure in the same layout as used with Haitz’s Law and added lines for factors of 100 per 20 years to the cost points and 1000 per 20 years to the installed capacity points.
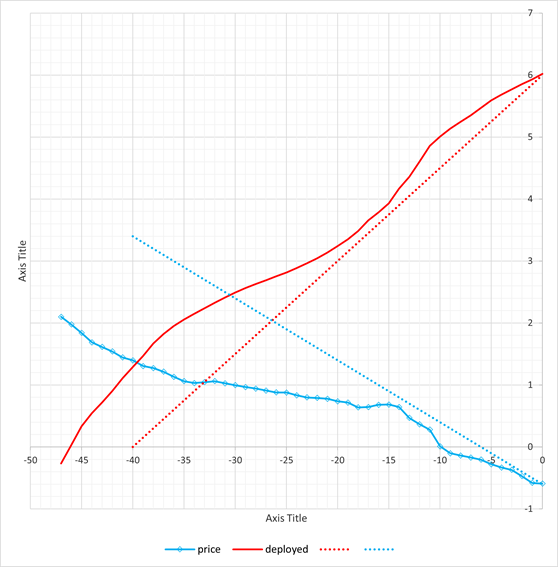
The fit is not too bad for the last two decades.
Finally I have taken the data from “The cost of 66 different technologies over time” and for each of the technologies normalised them to the final value and plotted with the final date aligned on a log axis. I have added lines for The Guide Cost Decline and the Guide Growth Rate for cheapness.
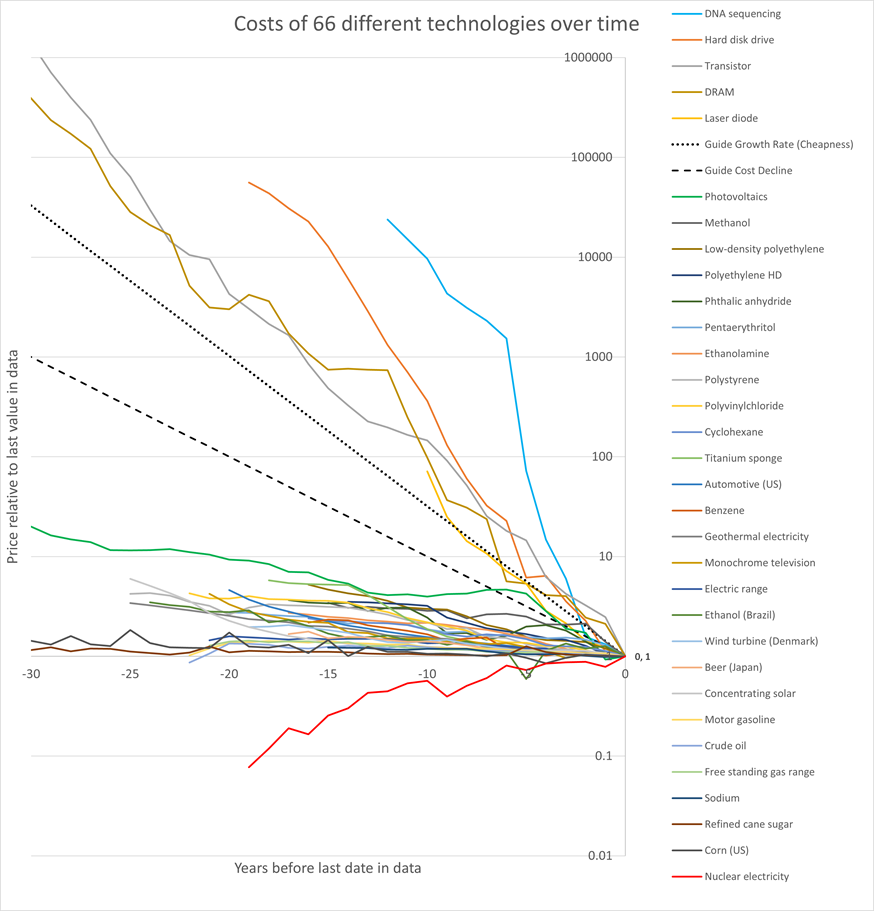
To simplify this chart I have arbitrarily removed all the data sets lasting less than 15 years unless they looked significant.
I have removed data milk and corn production where the economics of farming will be more important than technology.
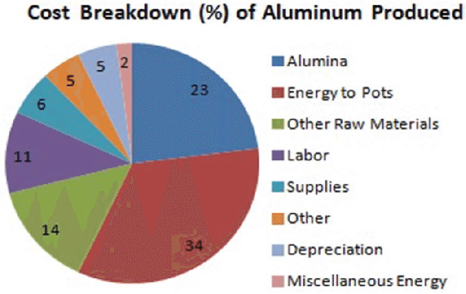
I have also removed data for the production of aluminium and magnesium where the cost is largely due to the cost of energy and raw materials. For aluminium this is more than half as shown in the figure below. The cost of magnesium produced by electrolysis will be similar. (Currently magnesium is reduced to the metal using fossil fuels. Not very Green!)
The result is a bit less busy but still makes the essential point.
We see that the guide growth rate has been exceeded significantly by only by cost of disc drives and DNA sequencing.
Chart
Data
The cost of 66 different technologies over time Our World in Data (2024). Data adapted from Farmer and Lafond.
https://ourworldindata.org/grapher/costs-of-66-different-technologies-over-time